暗号資産 2026.03.22 00:51
BTC Resistance Break Imminent? On-Chain Liquidity Signals Next Bull Move
レポート一覧に戻る本日の要約 (TL;DR)
01
Interest Correlation (Approx): 0.10 (Positive)
02
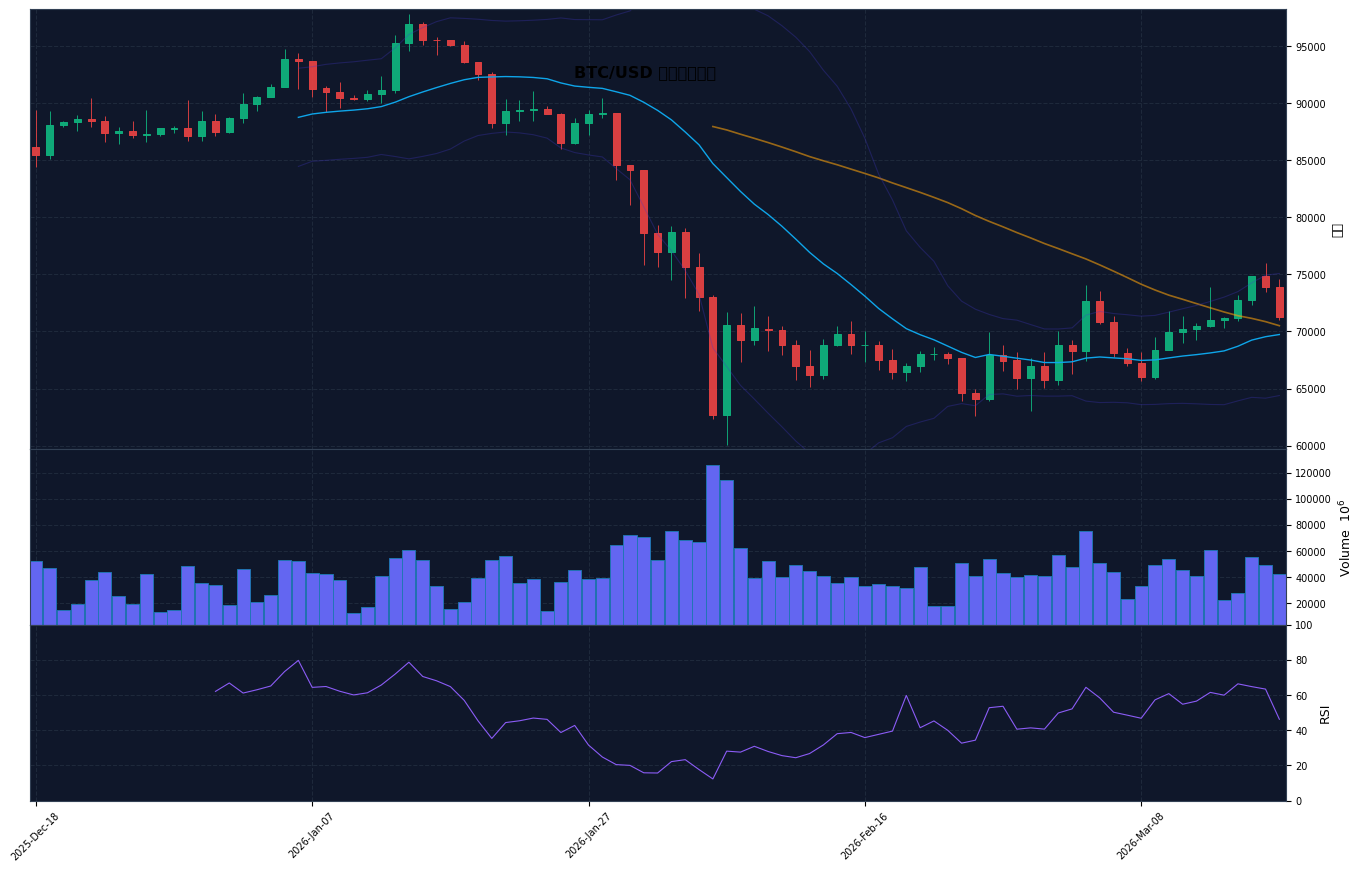
Technical: Driven by Price 70624.45 vs MA20 70354.47
03
Liquidity: Targets based on Upper Band 74740.67 / Lower Band 65968.28 / Recent High 75988.40 / Recent Low 65303.14
目次
Market Environment & Fundamentals
- Keywords: #BitcoinETF #LiquidityRecovery #TrendContinuation #OnChain
- Summary: Today's AI Analysis shows that BTC/USD's supply and demand are aligned with the major moving average (MA20), indicating a bullish bias. Additionally, shifts in interest rate correlation define the sustainability of the current trend.
- Latest Market Headlines
- Grayscale files for HYPE ETF tracking largest onchain perps DEX Hyperliquid
- ‘Replacing humans is not close’: BlockSec challenges EVMBench on AI auditing
- Lawmakers reach breakthrough with ‘agreement in principle’ over stablecoin yield in sweeping crypto bill
- Solana Foundation president says crypto gaming is dead
- Kalshi faces temporary halt in Nevada as court grants restraining order: reports
Multi-Dimensional AI Analysis (Synapse)
Interest Rate Correlation
The approximate correlation between yields (US10Y proxy) and BTC/USD is 0.10, observing a positive direction. This means interest rate movements are likely to be the primary price driver.
Order Book Analysis
Order flow concentrations at Upper Band 74740.67 / Lower Band 65968.28 / Recent High 75988.40 / Recent Low 65303.14 are likely to function as short-term liquidity aggregation points. We anticipate profit-taking particularly around the upper bands.
Sentiment Analysis
Fear & Greed Index (F&G)
Technical Analysis
- Reference Data: Close (Price) 70624.45, RSI(14) 60.57, 20-day Moving Average MA20 70354.47.
- Relationship with MA20: The daily close is currently in the Bullish Zone. Key Analytical Points:
- As long as 70624.45 maintains its position relative to MA20 70354.47, the dominant scenario remains prioritized.
- The timing of RSI(14) 60.57 breaking out of its range will trigger a re-evaluation of liquidity zones (BB/recent highs/lows).
- Consider securing earnings near the profit target TP 75988.40.
Professional Trading Strategy
Trading Action Card
Target Price
75988.40
Stop Loss
65303.14
Conclusion & Action Plan
- Executive Summary: Today's AI analysis confirms alignment between interest rate correlation and technical indicators, prioritizing a 'buy on dips' strategy. Profit-taking is advised at key dynamic resistance levels, with strict stop-loss management based on recent support.
- Next Step:
- Monitor if the stop-loss zone (SL 65303.14) can be maintained.
- Execute phased profit-taking once the target (TP 75988.40) is reached.
- Use the breakout of the recent high 75988.40 as a primary decision factor.
AI 結論 & アクションプラン
現在の市場環境に基づき、AIは慎重かつ戦略的な取引を推奨します。
Next Step
- • 主要なサポート・レジスタンスラインの監視
- • 経済指標発表時のボラティリティ警戒
- • 資金管理の徹底とリスク分散